
When you create a categorical data from a continuous value data(e.g. categorical raster based on a slope, elevation etc.) or managing a category, reclassify function is key. This process is very important to create a potential map(suitable map, probability map, etc.).
Input raster
In this tutorial, we are going to use the below slope map. The map is colored by slope categories(e.g. 15 < slope <= 30). Its value is continuous(0-90 degree).

Reclassify the slope map
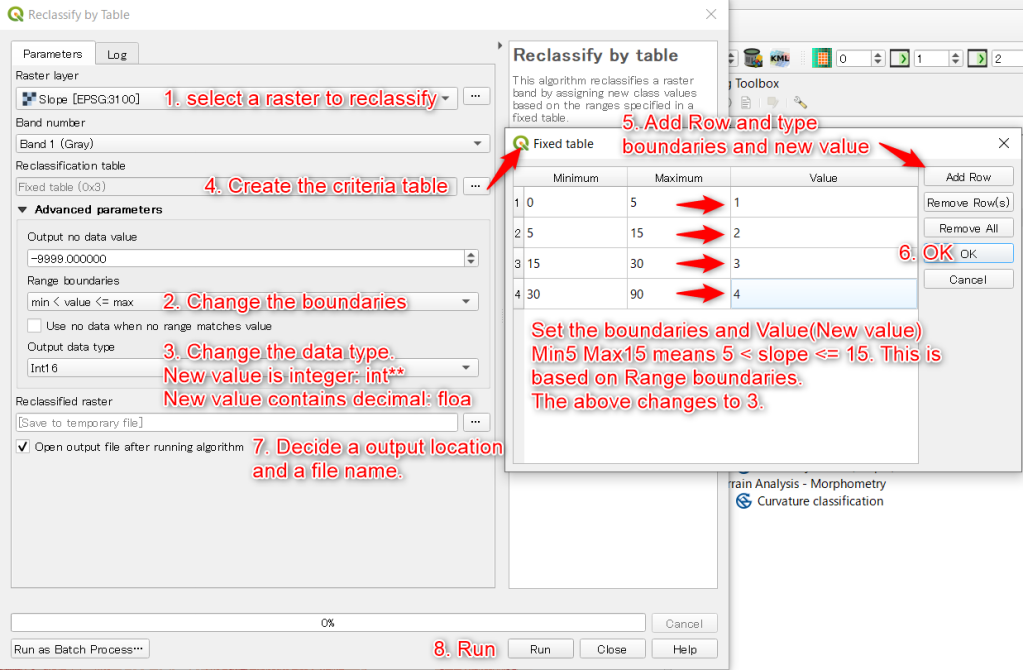
There are some functions to reclassify a raster in processing toolbox(including SAGA and GRASS). In this tutorial, we are going to Reclassify by table under Raster analysis. I am used to using the same function in ArcGIS. I thought that Reclassify by table in QGIS is simple and good to use.

Open Reclassify by table.
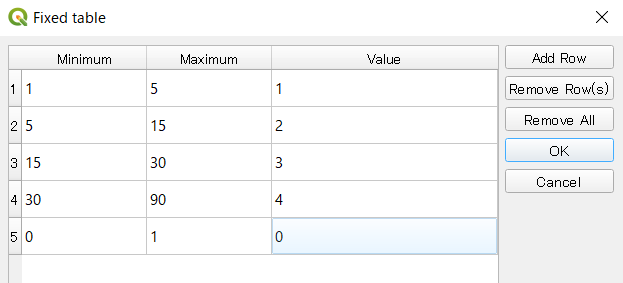
Go to Processing toolbox > Raster analysis > Reclassify by table > Change settings like below > Run
Check the result
Change the color settings to unique color using the new value. The original slope(continuous value) map has been converted to a categorical slope map!!

Farther analysis
You can use the map as one of factors of modeling. The simplest modeling is score based modeling using “weighted sum” concept.
